
River Discharge
River discharge is the volume of water flowing through a river channel. This is the total volume of water flowing through a channel at any given point and is measured in cubic metres per second (cumecs). The discharge from a drainage basin depends on precipitation, evapotranspiration and storage factors. Drainage basin discharge = precipitation – evapotranspiration +/- changes in storage.
Storm Hydrographs
Hydrographs can be used to illustrate discharge. These can be used to show annual discharge patters of flow in relation to climate. Over the short term, a flood or storm hydrograph (figure 1.) can be used to show short term variations. They cover a relatively short time period, usually hours or days rather than weeks or months. Storm hydrographs allow us to investigate the relationship between a rainfall event and discharge.
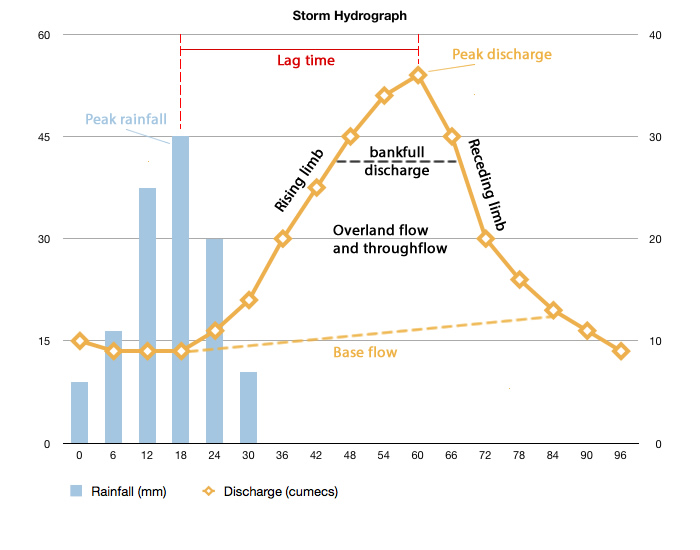
Figure 1. A storm hydrograph
The starting and finishing level show the base flow of a river. The base flow is the water that reaches the channel through slow throughflow and permeable rock below the water table. As storm water enters the drainage basin the discharge rates increase. This is shown in the rising limb. The highest flow in the channel is known as the peak discharge. The fall in discharge back to base level is shown in the receding limb. The lag time is the delay between the maximum rainfall amount and the peak discharge.
The shape of a hydrograph varies in each river basin and each individual storm event. The hydrographs below show two contrasting environments.
Before Urbanisation
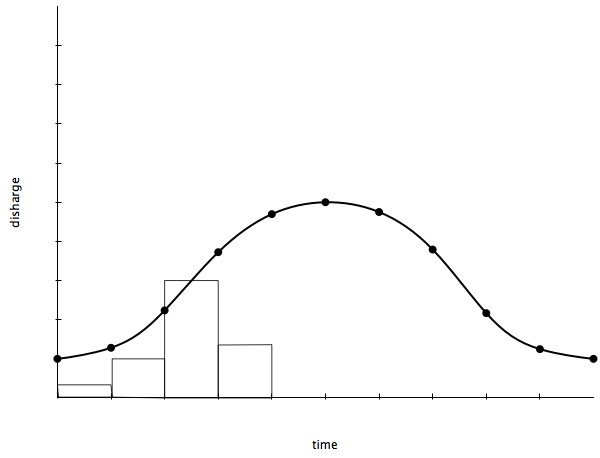
Figure 2. Hydrograph before urbanisation
Rural areas with predominantly permeable rock increases infiltration and decreases surface runoff. This increases lag time. The peak discharge is also lower as it takes water longer to reach the river channel.
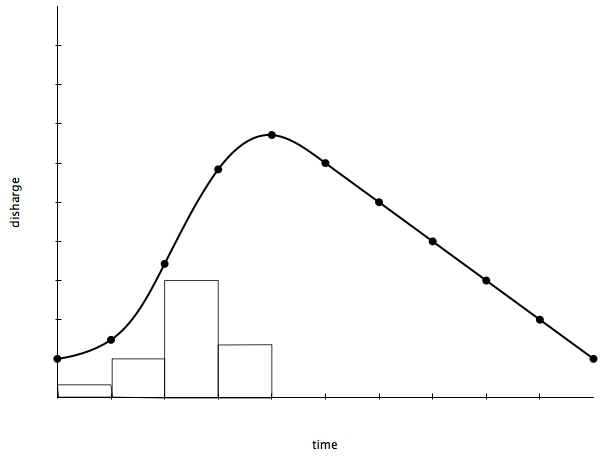
Figure 3. Hydrograph following urbanisation
Urbanisation is the main human impact on a storm hydrograph. Surface runoff increases when areas are urbanised due to the removal of top soil and vegetation. As roads, pavements and buildings are constructed the surface becomes impermeable. Laying drains leads to the rapid transportation of water to river channels which reduces the lag time.
Physical factors affecting storm hydrographs
There is a range of physical factors that affect the shape of a storm hydrograph. These include:
1. Large drainage basins catch more precipitation so have a higher peak discharge compared to smaller basins. Smaller basins generally have shorter lag times because precipitation does not have as far to travel. The shape of the drainage basin also affects runoff and discharge. Drainage basins that are more circular in shape lead to shorter lag times and a higher peak discharge than those that are long and thin because water has a shorter distance to travel to reach a river.
2. Drainage basins with steep sides tend to have shorter lag times than shallower basins. This is because water flows more quickly on the steep slopes down to the river.
3. Basins that have many streams (high drainage density) drain more quickly so have a shorter lag time.
4. If the drainage basin is already saturated then surface runoff increases due to the reduction in infiltration. Rainwater enters the river quicker, reducing lag times, as surface runoff is faster than baseflow or through flow.
5. if the rock type within the river basin is impermeable surface runoff will be higher, throughflow and infiltration will also be reduced meaning a reduction in lag time and an increase in peak discharge.
6. If a drainage basin has a significant amount of vegetation this will have a significant effect on a storm hydrograph. Vegetation intercepts precipitation and slows the movement of water into river channels. This increases lag time. Water is also lost due to evaporation and transpiration from the vegetation. This reduces the peak discharge of a river.
7. The amount precipitation can have an effect on the storm hydrograph. Heavy storms result in more water entering the drainage basin which results in a higher discharge. The type of precipitation can also have an impact. The lag time is likely to be greater if the precipitation is snow rather than rain. This is because snow takes time to melt before the water enters the river channel. When there is rapid melting of snow the peak discharge could be high.
Human factors affecting storm hydrographs
There is a range of human factors that affect the shape of a storm hydrograph. These include:
1. Drainage systems that have been created by humans lead to a short lag time and high peak discharge as water cannot evaporate or infiltrate into the soil.
2. Areas that have been urbanised result in an increase in the use of impermeable building materials. This means infiltration levels decrease and surface runoff increases. This leads to a short lag time and an increase in peak discharge.
Key Terms
Hydrograph – a graph that shows river discharge and rainfall over time.
Flood – when the capacity of a river to transport water is exceeded and water flows over its banks.
Base flow – The base flow of the river represents the normal day to day discharge of the river and is the consequence of groundwater seeping into the river channel.
Storm flow – storm runoff resulting from storm precipitation involving both surface and through flow.
Bankfull discharge – the maximum discharge that a particular river channel is capable of carrying without flooding.
Peak discharge – the point on a flood hydrograph when river discharge is at its greatest.
Peak rainfall – the point of a flood hydrograph when rainfall is at its greatest.
Lag time – period of time between the peak rainfall and peak discharge.
Today’s most popular pages
Support
If you have found this site useful please support us keeping A Level Geography free by making a small, secure donation via Paypal towards to the running costs of the site.
Many thanks,
Anthony
You must be logged in to post a comment.